The broad market is continuing its massive run higher as the calendar digs into summer.
Year to date, the big S&P 500 index is up more than 17.5% on a total returns basis. Just to put that into perspective, if that breakneck pace kept up for the rest of the year, the S&P would end the year with a 41.5% return.
And momentum is the name of the game in 2019. The stocks that have established leadership positions in this market environment are continuing to lead their peers higher here. Case in point: Advanced Micro Devices (AMD – Get Report) .
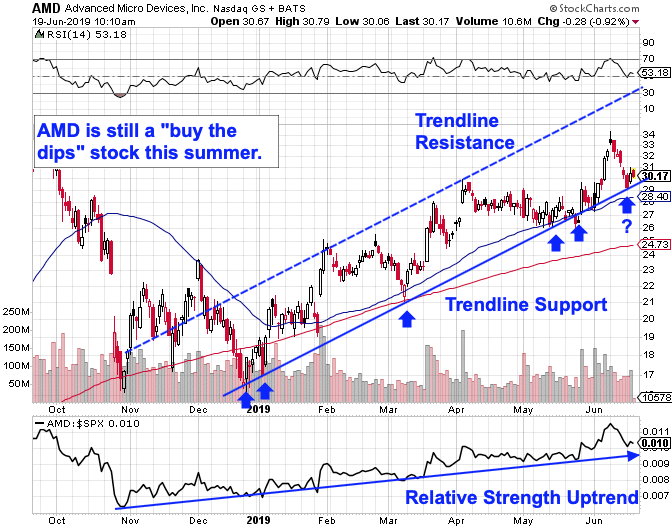
AMD has been a serial outperformer since the calendar flipped to January, up more than 65% during that stretch. And from a technical standpoint right now, shares look as if they’re showing investors a buyable dip this week before the next up-leg.
To figure out how to trade shares of AMD here, we’re turning to the chart for a technical look.

AMD’s uptrend essentially kicked off with the new year. Since the final days of 2018, shares of this tech momentum name have been bouncing their way higher in an extremely well-defined uptrend.
The last time we looked at AMD, shares were testing their “buy zone” right at trendline support during the first week of May. In the weeks that followed, AMD bounced off of support, making a 26% move higher before finding resistance up around $34. Now, we’re seeing virtually the same price pattern show up in June.
Simply put, the bounce AMD is showing investors this week looks like a solid buying opportunity.
Risk management remains key, particularly as investors generally become more anxious about the market’s next likely move. The 50-day moving average has been acting like a solid proxy for trendline support, and that makes it a logical place to park a protective stop below, if you’re long AMD.
If AMD materially violates its 50-day, then the uptrend is over and you don’t want to own it anymore.
The word “materially” is key here – AMD spent two sessions right below the 50-day during its prior test of support without busting its trend. It makes sense to keep a reasonably loose leash on this trend given its momentum.
That’s echoed by relative strength, the indicator down at the bottom of AMD’s chart. The uptrend in our relative strength gauge is an indicator that shares are continuing to systematically outperform the rest of the broad market right now. This powerful trend remains in play this summer.
Save 57% with our July 4th Sale. Join Jim Cramer’s Action Alerts PLUS investment club to become a smarter investor! Click here to sign up!
Watch: What Did the World Look Like Before Photoshop? A History of Adobe