Markets are reeling Friday, the big S&P 500 index selling off more than 2% in this afternoon’s session following another round of trade war escalation with China.
President Trump tweeted that he would order American companies to start looking for an alternative to China for manufacturing, a rebuttal to China’s State Council’s Customs Tariff Commission announcing that it would levy two batches of new tariffs effective next weekend and Dec. 15, respectively.
The trade war drama is surely far from over at this point.
As a consequence, it’s set to be another lousy week for the stock market – the fourth straight decline for the S&P, in fact.
But that only tells part of the story. Often, when volatility gets injected into the broad market, the technical picture can provide some crucial context. Namely, is the selling we’re experiencing here a good opportunity to be a buyer?
Or is the market looking ready to throw in the towel and point lower for the rest of 2019?
To figure out the most likely trajectory for the S&P from here, we’re turning to the charts for a technical look.

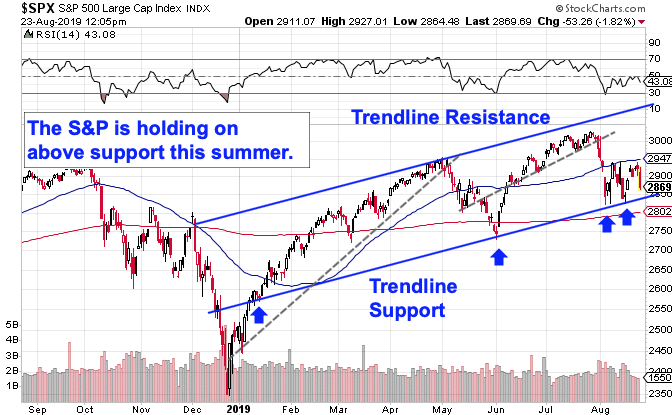
First, the good news. It doesn’t take a technical trading whiz to see that the S&P 500’s price trajectory continues to look extremely constructive here.
While there have been a couple of revisions to the S&P 500’s uptrend in the shorter-term, the longer-term trend from January remains intact here with a series of higher highs and lows.
In other words, we’re still very much in a “buy the dips market”.
Just as importantly, that uptrend gives us a clear do-not-cross line that would signal an end to the trend if violated. Right now, that level comes in right around 2,825 for the S&P 500. A material breach of that level means that downside risk in the market just ramped higher.
Until then, the trend is your friend.
That’s true in the much longer-term, too:

The chart above shows the weekly price action of the S&P 500 reaching all the way back to early 2013. The S&P’s price action has been near-linear over that stretch, with clearly-defined support connecting major lows of 2012, 2016, and 2018, and a return line at higher levels currently in play.
If the 2,825 level in the S&P were to get broken through, a test of primary support at around 2,550 becomes likely.
That’s more than 10% additional downside from here before the S&P 500’s long-term uptrend even gets tested.
Despite the trade war, recession fears, and headline risk galore, the stock market isn’t on the verge of collapse this summer – in fact, it’s not even waving a caution flag yet.
This may be another lousy week for the market, but the technical evidence points to more upside ahead for the broad market.