Shares of drugstore chain CVS Health Corp. (CVS – Get Report) are surging higher in reaction to earnings Wednesday, up more than 4.23% as of this writing.
Excluding extraordinary items, CVS posted a first-quarter profit of $1.62 per share, besting the $1.511 that analysts on Wall Street were looking for, on average. That positive earnings surprise is translating into a 5.6% pop in shares out of the gate to start the session. Management pointed to its Aetna acquisition as a major driver of the earnings beat, a fact that’s getting some investors invigorated again.
The earnings pop is needed – CVS bulls have had a rough ride in the last year, as shares shed about 13% in the trailing 12 months on a total returns basis, underperforming the rest of the S&P 500 by a gut-wrenching 26%.
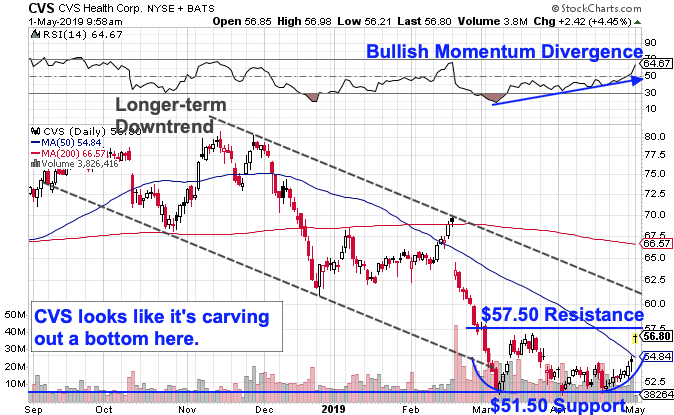
But that rout could finally be coming to an end as CVS begins to put in a long-term bottom this spring. To figure out how to trade it from here now that earnings are in the books, we’re turning to the chart for a technical look:

At a glance, it’s hard to miss the well-defined long-term downtrend that’s harangued CVS bulls for the better part of the last year. Stretching back to the end of Summer 2018, the trend channel has done a stellar job of corralling CVS’ price action. Until March of this year, that is.
When CVS made new lows in March, shares actually overshot the bottom of their trend channel, and they’ve been consolidating sideways above strong support at the $51.50 level ever since. That change in this stock’s trajectory sets the stage for CVS to put in the bottom that’s taking shape here.
The key level to watch right now is $57.50, a line in the sand that shares are currently trading within grabbing distance of at noon Wednesday.
Simply put, if CVS can materially close above $57.50, we’ve got a signal that buyers are back in control of the price action in the near term.
That shift in control of shares is being confirmed in part by price momentum, measured by 14-day RSI at the top of CVS’ chart. Our momentum gauge has been in an uptrend of its own since the March lows in CVS’ price, a bullish divergence that indicates building buying pressure.
Trendline resistance, currently just above $60, still represents a bit of an upside barrier for CVS here, but the change in trajectory that we saw back in March lends some credence to the idea that the trend channel that’s pushed shares lower this year is busted.
Bottom line: If CVS can break above $57.50 this week, it finally makes sense to join the buyers.