Home Blog Page 78

Realty Income Is a ‘Buy the Dips’ Stock Post Earnings

Realty Income Is a ‘Buy the Dips’ Stock Post Earnings

Shares of Realty Income Corp. (OGet Report) are seeing unusual volume Thursday, up as much as 2% early in the session on the heels of better-than-expected first-quarter earnings.

Realty Income posted funds from operations of 81 cents per share, besting analysts’ average guess by a penny. The trend has been a friend to real estate investment trusts in 2019 – and not just Realty Income. The popular Vanguard Real Estate ETF (VNQGet Report) has charged 21.5% higher since the calendar flipped to January, outperforming the strong 17% rally in the S&P 500.

Much of that upside has been propelled by a Fed that’s been more dovish than most investors could have predicted a year or two ago. And with interest rate conditions looking unlikely to change in the near to medium term, REITs continue to look like an attractive segment of the market overall.

Meanwhile, with earnings risk out of the way, Realty Income is leading the pack from a technical standpoint. To figure out how to trade shares from here, we’re turning to the chart:

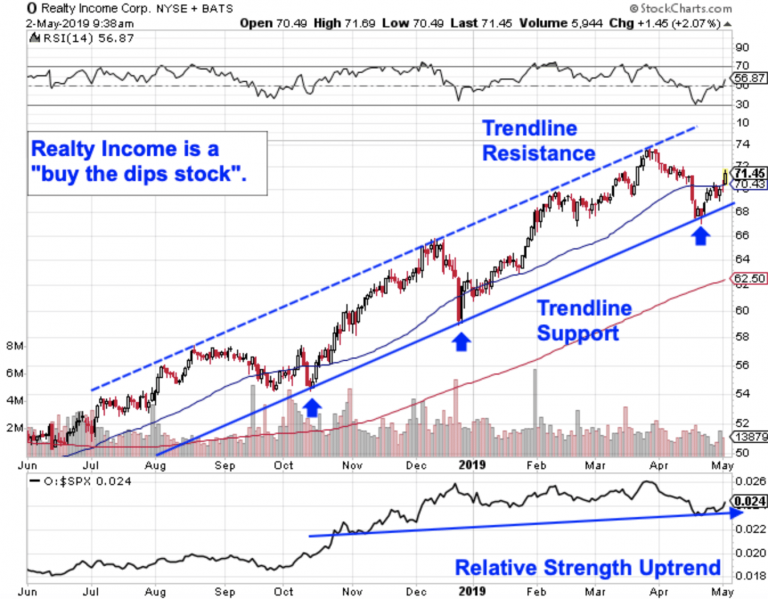
You don’t have to be an expert technical trader to figure out what’s going on in shares of Realty Income right now; in fact, the price trajectory of this $21 billion REIT is about as straightforward as it gets.

Realty Income has been bouncing its way higher in an extremely well-defined uptrend for the better part of the last year. Simply put, every test of trendline support along the way – and in particular since last fall – has provided a low-risk buying opportunity before the next leg higher.

It’s a textbook example of a “buy the dips” stock.

Now, with Realty Income bouncing off of support once again, we’re seeing what looks like a solid opportunity to buy.

Relative strength, which measures Realty Income’s outperformance vs. the rest of the broad market, points to more upside ahead. The price bounce we saw in April helped relative strength put in a pair of higher lows, signaling that this stock continues to systematically outperform the rest of the broad market on a price basis right now.

Despite all of the evidence for higher ground in Realty Income, risk management remains key here. If you’re considering joining the buyers this spring, this REIT’s prior swing low at $67 makes a logical place to park a protective stop below. Simply put, if Realty Income violates that $67 low, then the uptrend is broken, and you don’t want to own it anymore.

Meanwhile, Realty Income’s trend looks alive and well as shares push into May. Earnings in the rearview mirror remove a key potential stumbling block on the way up.
CVS Looks ‘Bottomy’ Following Its Earnings Pop

CVS Looks ‘Bottomy’ Following Its Earnings Pop

Shares of drugstore chain CVS Health Corp. (CVSGet Report) are surging higher in reaction to earnings Wednesday, up more than 4.23% as of this writing.

Excluding extraordinary items, CVS posted a first-quarter profit of $1.62 per share, besting the $1.511 that analysts on Wall Street were looking for, on average. That positive earnings surprise is translating into a 5.6% pop in shares out of the gate to start the session. Management pointed to its Aetna acquisition as a major driver of the earnings beat, a fact that’s getting some investors invigorated again.

The earnings pop is needed – CVS bulls have had a rough ride in the last year, as shares shed about 13% in the trailing 12 months on a total returns basis, underperforming the rest of the S&P 500 by a gut-wrenching 26%.

But that rout could finally be coming to an end as CVS begins to put in a long-term bottom this spring. To figure out how to trade it from here now that earnings are in the books, we’re turning to the chart for a technical look:

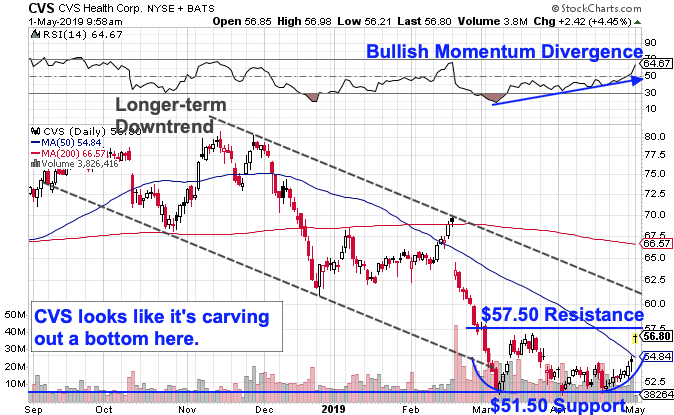
At a glance, it’s hard to miss the well-defined long-term downtrend that’s harangued CVS bulls for the better part of the last year. Stretching back to the end of Summer 2018, the trend channel has done a stellar job of corralling CVS’ price action. Until March of this year, that is.

When CVS made new lows in March, shares actually overshot the bottom of their trend channel, and they’ve been consolidating sideways above strong support at the $51.50 level ever since. That change in this stock’s trajectory sets the stage for CVS to put in the bottom that’s taking shape here.

The key level to watch right now is $57.50, a line in the sand that shares are currently trading within grabbing distance of at noon Wednesday.

Simply put, if CVS can materially close above $57.50, we’ve got a signal that buyers are back in control of the price action in the near term.

That shift in control of shares is being confirmed in part by price momentum, measured by 14-day RSI at the top of CVS’ chart. Our momentum gauge has been in an uptrend of its own since the March lows in CVS’ price, a bullish divergence that indicates building buying pressure.

Trendline resistance, currently just above $60, still represents a bit of an upside barrier for CVS here, but the change in trajectory that we saw back in March lends some credence to the idea that the trend channel that’s pushed shares lower this year is busted.

Bottom line: If CVS can break above $57.50 this week, it finally makes sense to join the buyers.

Watch Jim Cramer’s Daily NYSE Show and Replays Below

The Oil Trend Is in Play: 2 Ways to Trade It

Oil is surging this spring, coming back in a big way from a historic rout that sent crude prices plummeting about 45% from peak to trough in the fourth quarter of 2018, and included the worst losing streak for crude oil on record.

It’s been a completely different market in 2019.

Not only have crude prices retraced more than half of their tumble since the calendar flipped to January – the rebound rally in oil isn’t showing any signs of slowing down as we head into May.

That newfound bull market for oil has been getting some big attention from Wall Street lately; news hit Tuesday morning that Warren Buffett’s Berkshire Hathaway (BRK.AGet Report) (BRK.BGet Report) will invest $10 billion in Occidental Petroleum  (OXYGet Report) to help the producer secure its $38 billion bid for Anadarko Petroleum  (APCGet Report) .

To figure out how to trade oil from here, we’re turning to the charts for a technical look at two ways to play the trend.

Up first is oil itself, via the U.S. Oil Fund (USOGet Report) , the crude oil ETF that’s become investors’ easiest way to get exposure to crude prices:

At a glance, you don’t need to be an expert technical trader to spot the prevailing trend in oil prices right now. Since the start of January, USO has been in the midst of a very well-defined uptrend.

The first murmurs of a bullish reversal in oil actually started toward the end of November, thanks to a bullish reversal pattern called an inverse head and shoulders; that setup triggered a buy shortly after the uptrend when USO pushed through the $11.50 level. The fact that a pair of independent buy signals triggered within about a month of each other in USO provides solid confirmation for this rally’s staying power. So does the bounce we’re seeing off of USO’s trendline this week.

So far, every test of trendline support has been met with a bounce higher – and that’s proving to be the case now. This looks like as good a time as any to be a buyer of oil.

For a higher-beta way to play energy, take a look at Diamond Offshore Drilling Inc. (DOGet Report) :

By and large, energy producers haven’t participated in the resurgence in oil prices in 2019. That’s certainly been the case in shares of Diamond Offshore, which is down more than 8% as of this writing on the heels of a Q1 earnings call that included revenue and dayrate declines.

Still, Diamond’s price action has mirrored energy prices in that the playbook flipped from downtrend to exceptionally well-defined uptrend at the start of the new calendar year. Now, the earnings selloff is sending shares down for a pretty textbook test of trendline support.

So far, the last four tests of this level have provided strong buying opportunities before Diamond’s next move up to the top of its price range. If buyers step back in within the next couple of sessions, we could see the same thing again.

Risk management is key if you decide to trade this stock – it’s crucial to wait for buyers to step in and spur a bounce off support before taking this trade. Doing that means missing out on catching the very bottom of this swing, but it also mitigates a huge amount of risk if Diamond’s uptrend ends up getting violated by the earnings selloff.

Keep a close eye on how shares trade in the next couple of sessions. A bounce off of support provides action-hungry traders with an opportunity for some near-term upside.

AutoNation Is a Buy on Earnings

AutoNation Is a Buy on Earnings

Click to view a price quote on AN.